Unlock the power of your data with DR Developers. We are a leading provider of Data Visualization and Reporting services, dedicated to transforming complex data into insightful visualizations and comprehensive reports.
We worked with
Why Choose DR Developers?
With years of experience in the field, our team of skilled developers possesses the technical prowess and industry knowledge necessary to create visually stunning and impactful data visualizations and reports. We stay up-to-date with the latest tools and technologies to ensure we deliver cutting-edge solutions tailored to your unique requirements.
We understand that every business has its own set of goals and challenges. That’s why we take a personalized approach to our services, working closely with you to understand your specific needs. From data analysis and visualization design to report generation and interactive dashboards, we develop tailor-made solutions that align with your business objectives and help you gain actionable insights.
We believe that a picture is worth a thousand words, and our data visualizations reflect that philosophy. Our team excels at creating engaging and intuitive visual representations of your data, enabling you to quickly grasp complex trends, patterns, and outliers. We bring your data to life, making it easy for you to communicate information effectively and make data-driven decisions.
At DR Developers, we go beyond just visualizations. We provide comprehensive reporting services that empower you to track and analyze key performance indicators, monitor business metrics, and generate reports with precision and accuracy. Whether you need periodic reports, ad-hoc analysis, or interactive dashboards, we ensure your reporting needs are met with utmost efficiency and clarity.
We understand that data resides in various systems and formats within your organization. Our team has extensive experience in integrating diverse data sources, ensuring seamless connectivity and data integrity. We work with popular databases, CRMs, ERPs, and other data platforms to extract, transform, and load data into a unified visualization and reporting environment.
We value our clients and prioritize their satisfaction. Our dedicated support team is always available to address any queries or concerns you may have. We collaborate closely with you throughout the project lifecycle, providing regular updates, and ensuring that your vision is realized. We are committed to delivering high-quality solutions that meet your expectations and exceed them.
TECH
Harnessing Cutting- Edge Technologies for Data Visualization
Here are some of the popular technologies we use:
At DR Developers, we leverage a diverse range of powerful technologies to deliver exceptional data visualization solutions. Our expertise extends across a variety of platforms, ensuring that we can meet your specific requirements and provide you with the most effective visualization tools available.
Power BI
Power BI, developed by Microsoft, is one of the leading business intelligence and data visualization tools in the market. It offers a comprehensive suite of features for data modeling, interactive dashboards, and rich visualizations. With Power BI, we can transform your raw data into insightful charts, graphs, and maps that enable you to analyze trends, track KPIs, and share compelling reports with stakeholders.
Google Looker
Google Looker is a cloud-based data platform that combines data exploration, visualization, and collaboration capabilities. It allows us to connect to various data sources, create interactive dashboards, and build custom reports. With Looker, we can enable your teams to explore data intuitively, uncover hidden insights, and make data-driven decisions with ease.
Tableau
Tableau is a widely recognized data visualization and analytics platform that empowers organizations to explore and understand their data visually. It offers a user-friendly interface and a vast array of visualization options, including charts, graphs, and interactive maps. Tableau’s robust capabilities allow us to create engaging dashboards and reports that facilitate data exploration and storytelling.
QlikView
QlikView is a powerful data discovery and visualization tool that enables users to navigate and analyze data in a highly interactive and intuitive manner. With its associative data model, QlikView allows us to create flexible visualizations, uncover data relationships, and provide users with a holistic view of their data. Its unique approach to data visualization enables users to explore data freely and make data-driven decisions effortlessly.
Development stages
Data Visualization and Reporting Services
Requirement Gathering
We begin by thoroughly understanding your business goals, data sources, and specific visualization and reporting needs. Our team engages in detailed discussions with you to capture your requirements, identify key metrics, and gain insights into your data environment.
Data Analysis and Preparation
Once we have a clear understanding of your requirements, we analyze your data to assess its quality, structure, and relevance. We work closely with your team to gather and refine the data, ensuring that it is clean, accurate, and properly formatted for visualization and reporting purposes.
Visualization and Reporting Design
Based on your requirements and data analysis, our skilled designers and developers create a customized visualization and reporting plan. We select the most appropriate visualization techniques, design intuitive dashboards, and define the structure and layout of your reports. We pay attention to your branding guidelines and ensure that the visual elements align with your company’s identity.
Data Visualization Development
Using cutting-edge tools such as Power BI, Google Looker, Tableau, or QlikView, our development team transforms your data into captivating visualizations. We design charts, graphs, maps, and other visual elements to present your data in a meaningful and insightful manner. Our team focuses on interactivity and user experience, enabling you to explore and interact with the visualizations effortlessly.
Reporting Development
Concurrently, we develop comprehensive reports that provide a holistic view of your data. We structure the reports to highlight the most critical insights, key performance indicators, and trends. We ensure that the reports are easy to understand, visually appealing, and tailored to the target audience, whether it’s executives, stakeholders, or operational teams.
Integration and Deployment
Once the visualizations and reports are developed, we seamlessly integrate them into your existing data infrastructure or the chosen platform. We ensure that the visualizations and reports are accessible to the intended users through various channels, including web portals, desktop applications, or mobile devices.
Testing and Quality Assurance
Before delivering the final solution, we conduct rigorous testing to validate the accuracy, functionality, and performance of the data visualizations and reports. We ensure that the interactive features work smoothly, the data is up-to-date, and the visualizations are consistent across different devices and browsers.
Collaboration and Feedback
We collaborate closely with you throughout the process, seeking your feedback and incorporating any necessary revisions. We encourage an iterative approach, refining the visualizations and reports based on your inputs, ensuring that the final deliverables meet your expectations.
Training and Support
We provide training sessions to familiarize your team with the visualizations, reports, and any associated tools. Additionally, our dedicated support team remains available to address any queries or concerns, ensuring a smooth transition and ongoing assistance as you leverage the power of your data.
How can we help?
Your goal


OUR DIVERSE WORK RANGE
industries we
have helped
We have undertaken terrific projects for industries such as e-commerce, healthcare, education, finance, marketing, real estate and communication
Finance
Health
Real Estate
Small Business
E-Commerce
Education
Enterprises
CUSTOMER'S FEEDBACK
Reviews
Delivering the best and making the customers happy.
WORK WE HAVE DONE
Projects
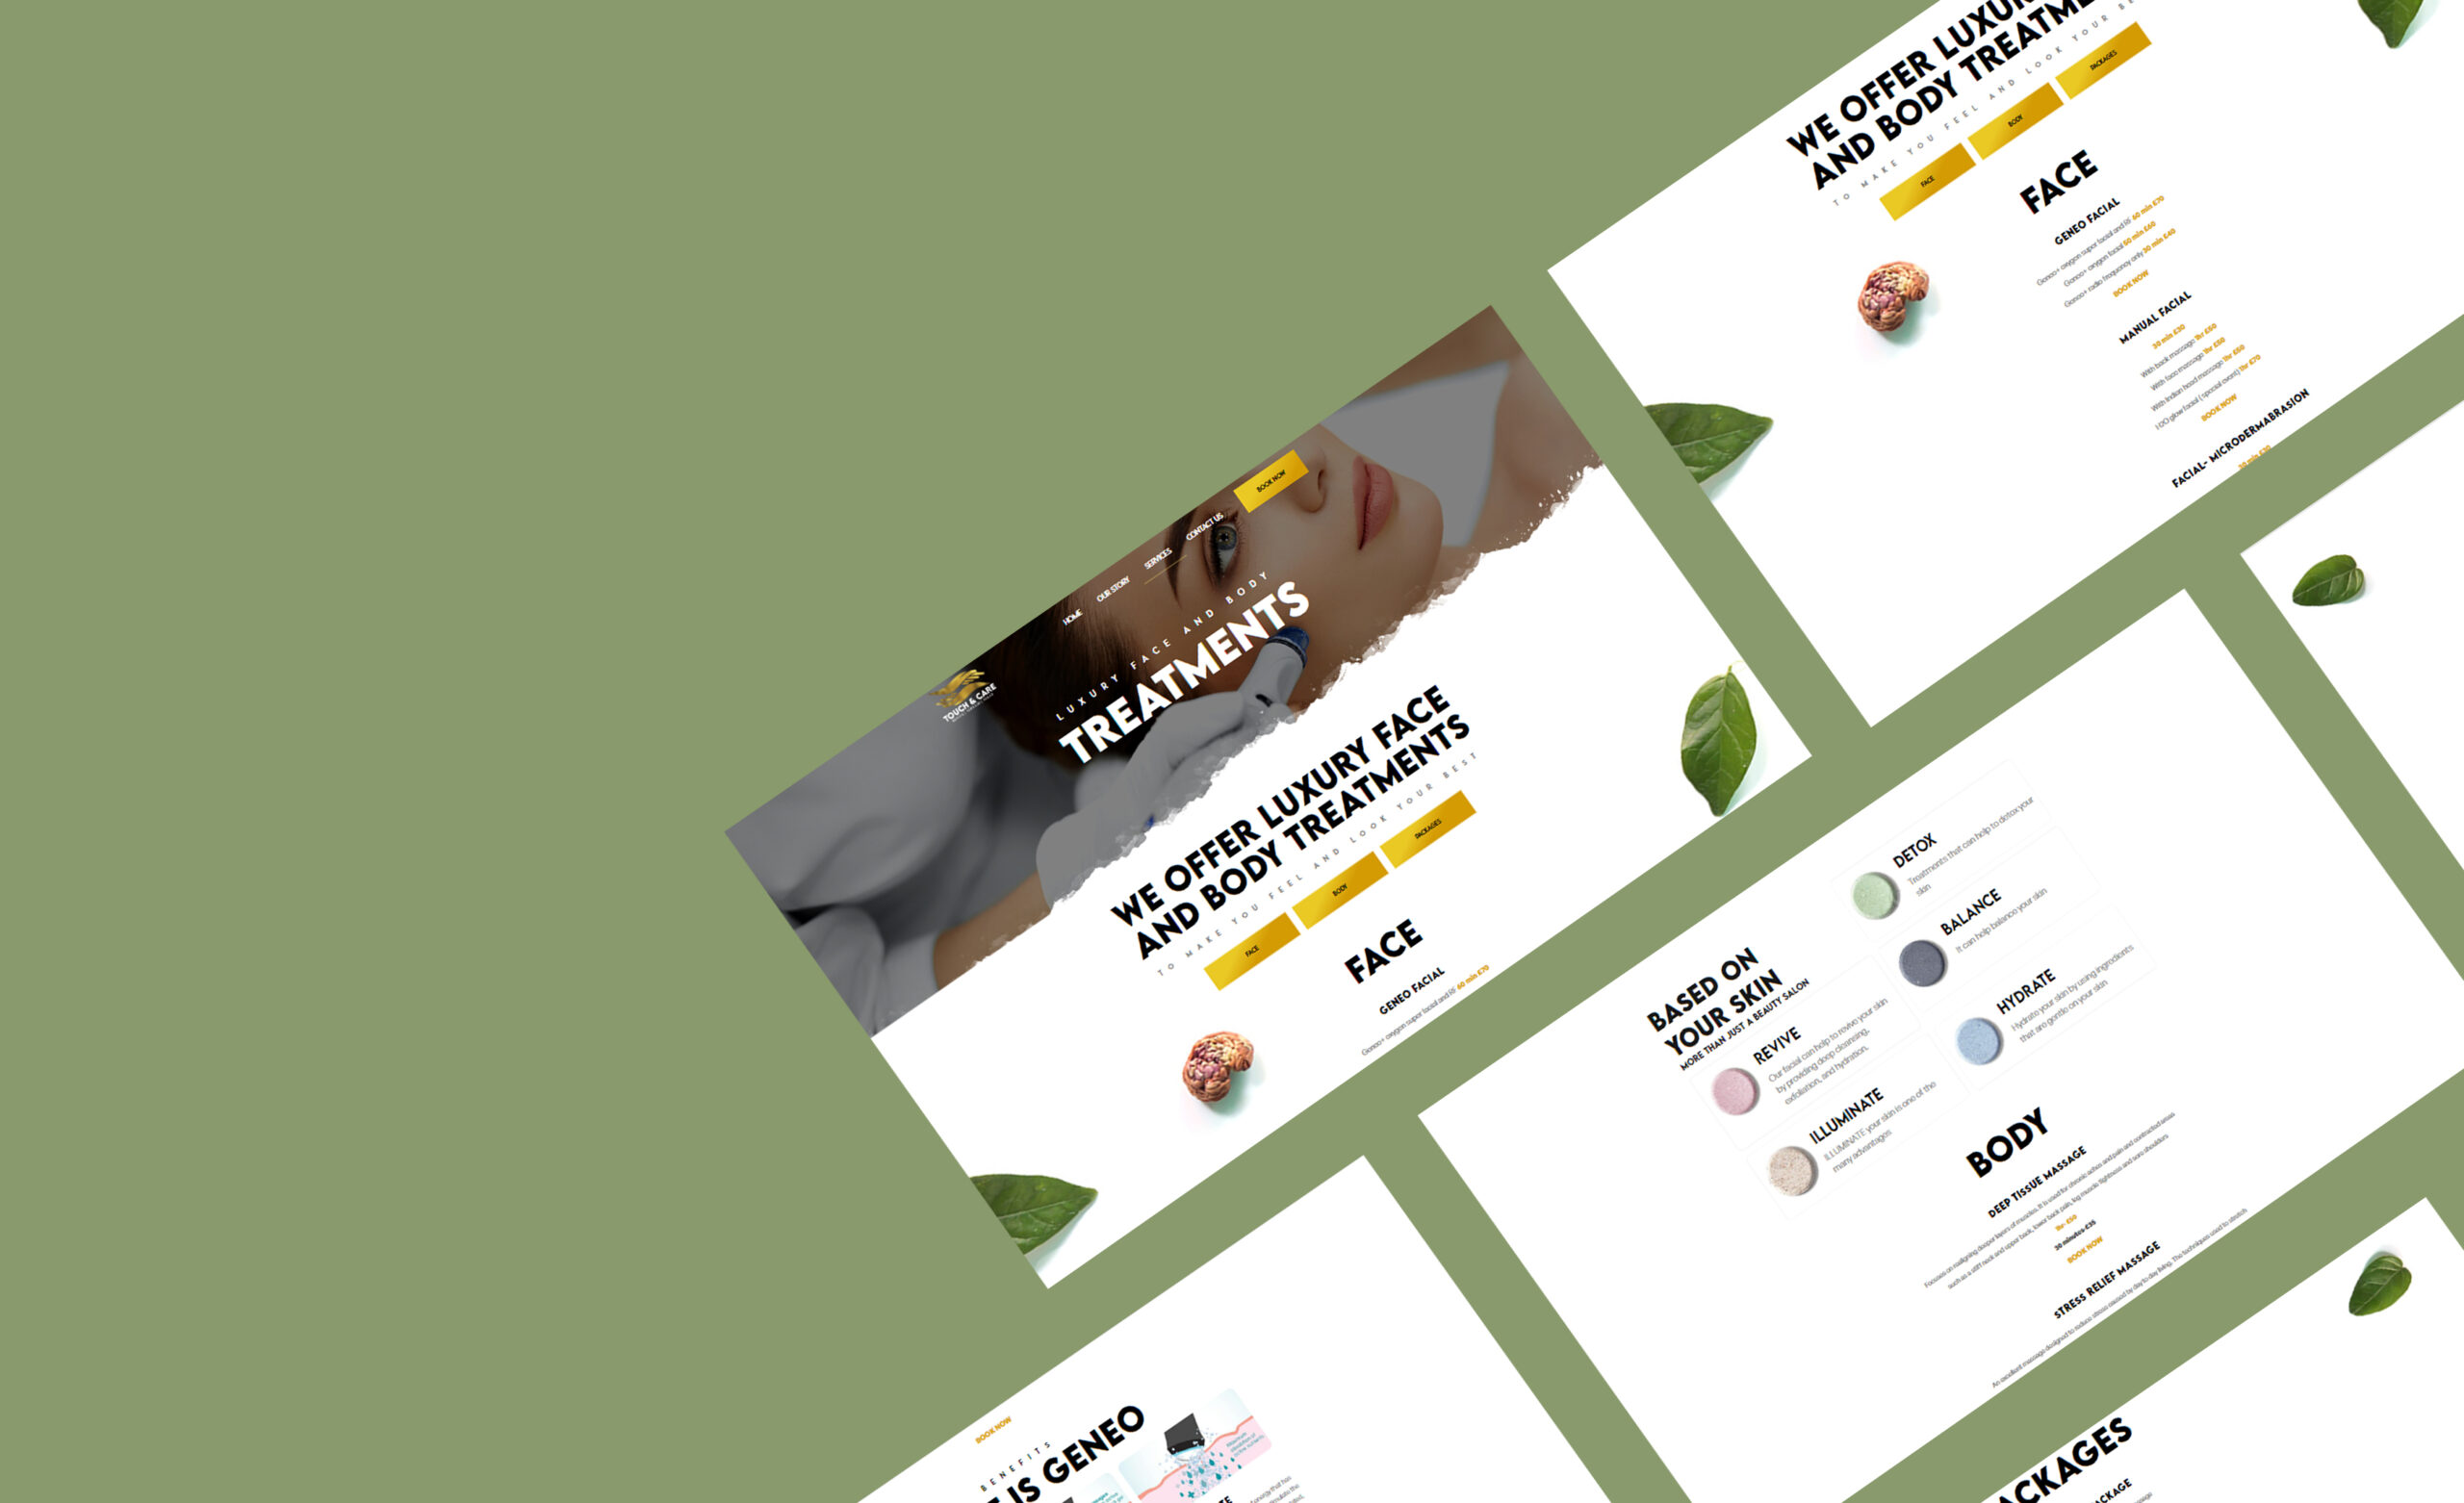
Custom website tailored for our client’s specific requirements
Touch and care is to provide our clients with the highest quality treatments possible. We use only the finest products and the most advanced techniques to ensure that our clients receive the best possible results. We believe that everyone deserves to look and feel their best, and we are dedicated to helping our clients achieve their goals.
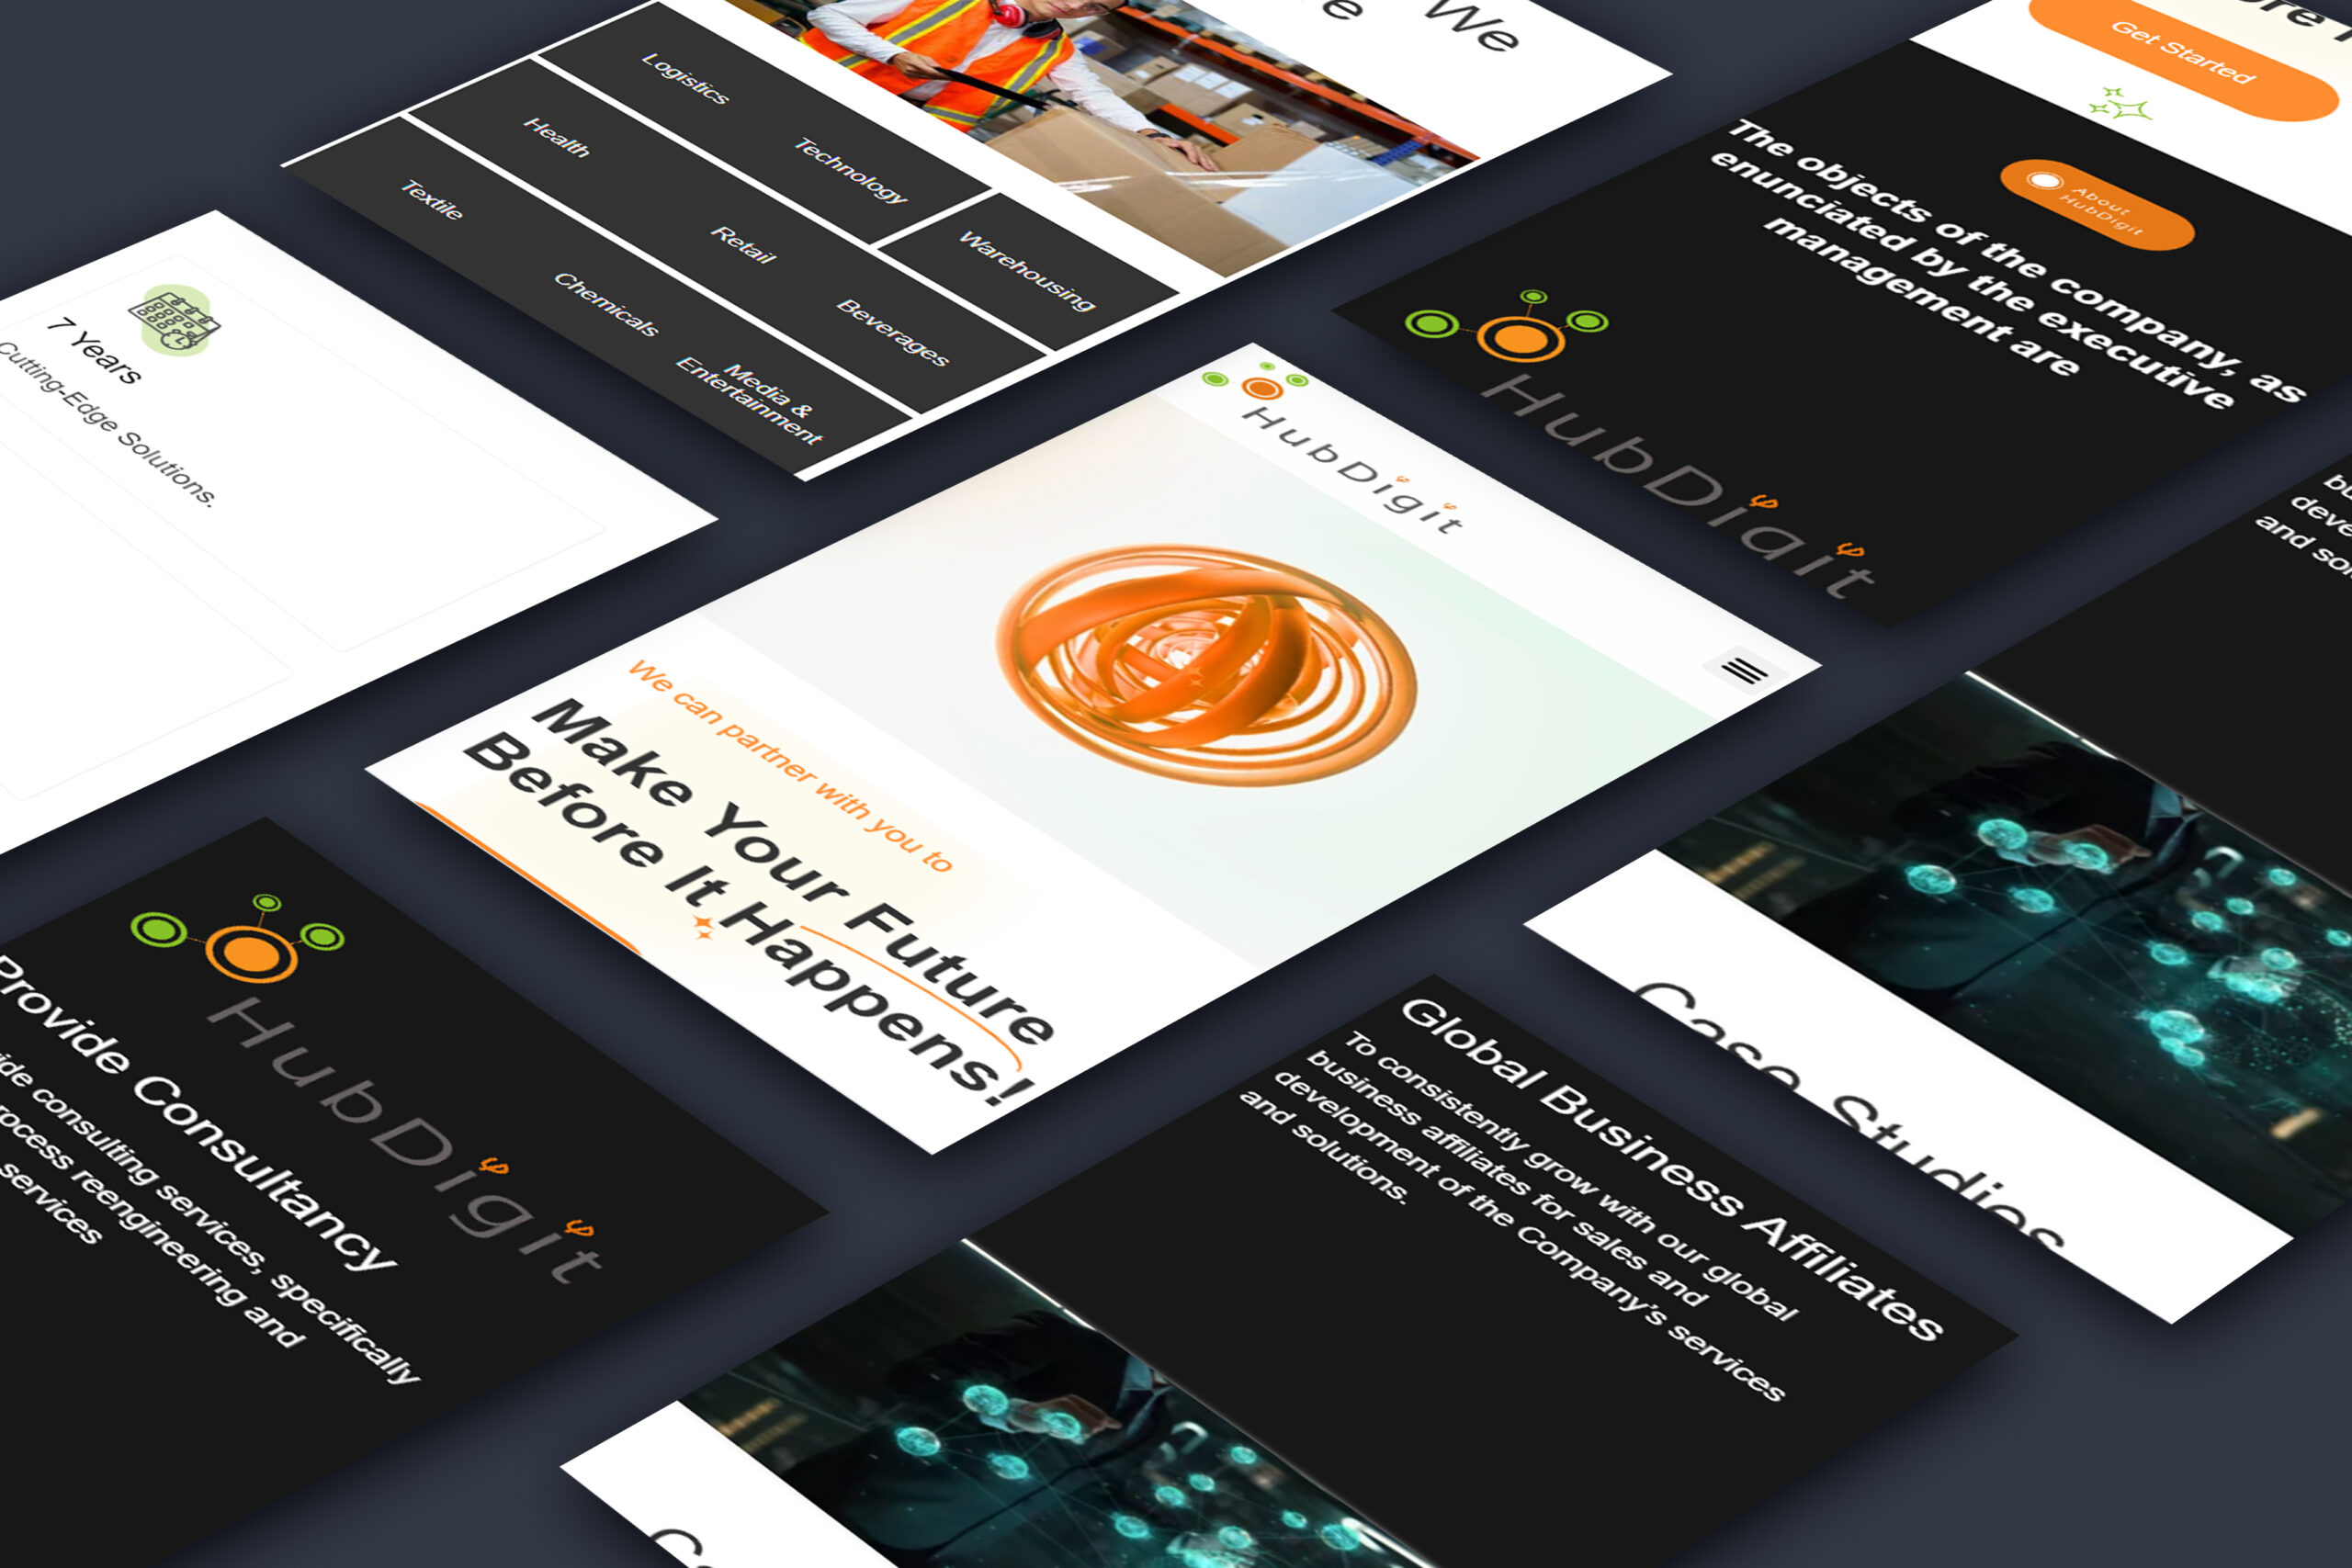
HubDigit is a progressive management consulting that focuses on applying cutting-edge technologies that eventually become the lifeblood and substance of all our services. Intertwined with our optimized shared services model for finance & accounting and our expertise with business process reengineering and other risk management services, we are always looking to deliver strategic value through cost-effective solutions.
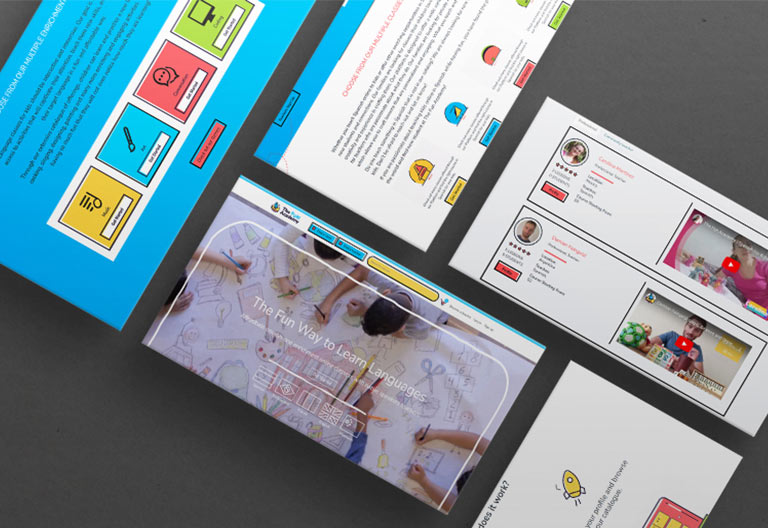
LMS System offers online training for kids in multiple dimensions with interactive sessions. It offers a user-friendly portal, online scheduling system, virtual learning in multiple languages, and instructors of choice. Dr. Developers integrated the learning management system with Zoom, improved the learning and teaching platform, and integrated the automated scheduling for their convenience.